Turn Data Into Intelligence & Insights
The numbers never lie. By unlocking the potential of data analytics, you can be more innovative, efficient and customer-centric than ever before. We can help you unlock powerful analytics insights by tapping into data you didn't even know you had.
What Is Data Analytics?
The explosion of data, growing ubiquity of technology and the insights it can deliver has provided businesses with insights previously inaccessible. The challenge now for many organisations is knowing how to interpret that data and turn the insights it provides into strategic intelligence for competitive advantage.
Data analytics can add real value to your business. It can help to drive faster and better decision-making, reduce costs and streamline business models.
Companies and executives who have been quick to recognise the opportunities data analytics presents are realising large-scale benefits and creating innovative solutions to establish an edge on their competitors.

Data Analytics Offerings at Fortis
Fortis experts offer a full range of big data services, from consulting and strategy definition to infrastructure maintenance and support, enabling our clients to get vital insights from previously untapped data assets. We apply a proprietary big data framework combined with popular technologies like Apache Hadoop as well as machine learning and deep learning algorithms to deliver a comprehensive tool set for storing, processing, and analyzing large quantities of data.
Tools and platforms we broadly work on:
- Microsoft Power BI (SSAS, SSIS, SSRS)
- Big Data - Hadoop
- Google Big Query
- Tableau
Fortis provides a full suite of data, analytics and insights related services and solutions to enterprise level entities looking to get more out of their data.
Fortis is able to use advanced analytical techniques and cutting edge technology to both analyse data, and create valuable data insights. We use this knowledge and expertise to help clients make the perfect connection with each and every one of their customers.
What Is Data Vizualization?
Your organization wants to rely on data-driven insights to inform decisions at all levels of the enterprise. But more and more rows of data rapidly become more and more noise. Data Visualization is the key to unlocking the true stories that your data has always wanted to tell. Building effective visualization on agile and extensible modern data platforms can become the key to unlocking silos of information and driving transformation forward for your career and your enterprise.

Fortis's Data Visualization services helps companies elevate data driven decision -making processes for business executives, software engineers, data scientists and researchers. We work with many global companies across a range of sectors to address their enterprise data virtualization needs. This broad experience helps us discover the disparate data relationships within our clients' data including uncover important data, faster and more easily.
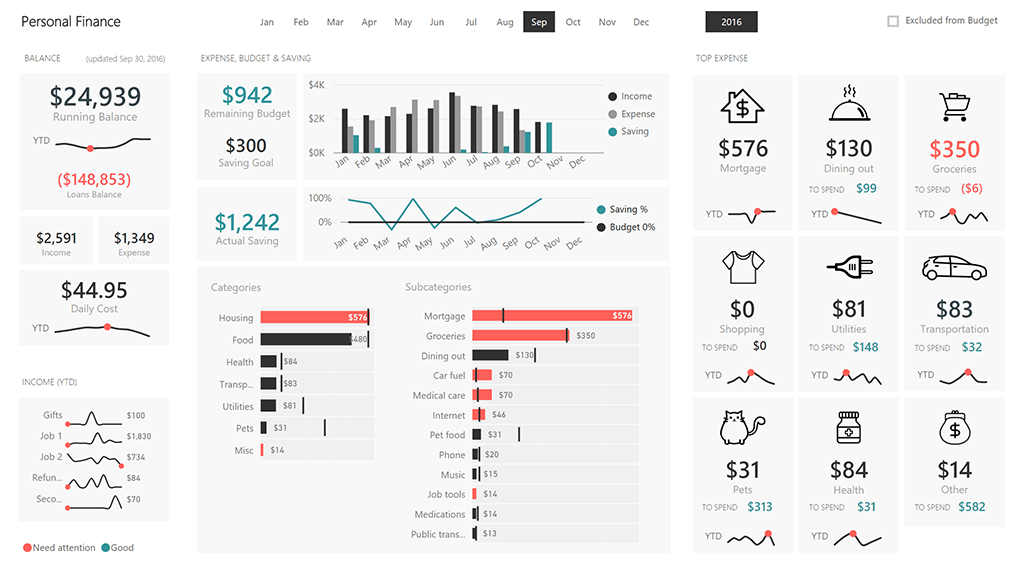
We use innovative tools and approaches such as information dashboards, mobile business intelligence (BI), self-service capabilities, data discovery and interactive data visualization to pull the real value out of data silos.
In brief, we work with you to discover unique insights or business intelligence that can help your organization take advantage of opportunities, minimize risks and control costs.

As one of the growing data visualization companies, our full-cycle analytics services mean that we are not limited to just data visualization offerings, allowing us to consult on data management, data warehouse (including ETL) and data marts development, big data consulting, advanced data analysis and more. We also offer data visualization consultants, and support and maintenance services, covering everything from performance to optimization, as well as further development of your existing data system, as well as migration from one analytical system to another.
Displaying data properly in a dashboard or in a report means making decisions, designing with a specific target audience in mind, including only the most relevant information, and picking charts carefully. People often create reports just by dropping data on the canvas, without proper planning. Don't worry, we will make it happen all - in extremely effective and efficient way.